


The Haemodynamic Jigsaw and Circulatory Optimisation.
Professor Brendan E Smith,
Anaesthetist and Intensivist,
University of Notre Dame, Australia.
Introduction
The primary role of the circulation is to deliver oxygen and nutrients to all the tissues in the body. Haemodynamics is the interplay of all the physiological systems involved in this process. As a simple rule, wherever there is adequate oxygen delivery to a tissue there will be adequate nutritional supply as well. We can therefore use oxygen delivery, DO2, as our marker of adequacy of the circulation. All the physiological systems involved in the circulation must work together as a harmonious whole if adequate DO2 is to be achieved.
In the past, it was not possible to measure DO2 directly, so clinicians came to rely on surrogate indices of circulatory performance which were more readily measured, including blood pressure (BP), heart rate (HR), oxygen saturation (SpO2) and even capillary refill time (CRT). Unfortunately, none of these, either singly or in combination, indicates what DO2 is.
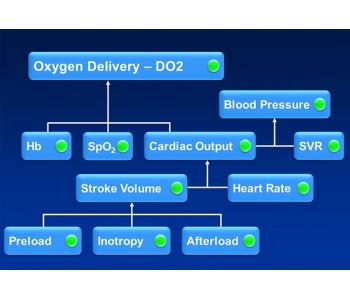
As figure 1 below shows, DO2 depends on three primary factors; cardiac output (CO), haemoglobin concentration ([Hb]) and SpO2. BP, even taken together with HR and SpO2, provides no guidance regarding oxygen delivery.
Fig. 1. The Haemodynamic Jigsaw.
Further, if there is a problem with inadequate DO2, then BP, HR and SpO2 may not tell us how to fix the problem. Whilst [Hb] and SpO2 are easily measured, if the problem is not anaemia or low oxygen saturation, then it must be a low CO. But if CO is low, is the problem due to a low HR or low stroke volume (SV)? HR is easily measured, but if this is not the problem, then it must be SV. But if SV is low, then why is it low and how do we fix it?
Stroke volume
SV depends on three factors, preload, inotropy (or myocardial contractility) and afterload. Broadly speaking, afterload is the force resisting ejection of blood from the left ventricle and can generally be regarded as the mean arterial pressure (MAP) which keeps the aortic valve closed and against which the ventricle must work to eject the stroke volume. Technically, afterload also includes ventricular stiffness and such problems as aortic stenosis or outflow tract obstruction, but so safely ignore these in most patients. If MAP is not elevated, then the cause of a low SV is unlikely to be an afterload issue. Is it due to an inadequate preload or is it inadequate inotropy, and how do we determine which?
Fluid challenge
Traditionally, most clinicians would approach the problem of a suspected low SV by giving a fluid challenge, but is this really a rational step? Whilst a fluid bolus might lead to an increase in SV if the problem were inadequate preload, it would also lead to a dilution of [Hb]. Giving a 1 litre rapid fluid bolus to a 70 kg adult might increase the SV by around 10-20%. Unfortunately, it would also decrease [Hb] by around 20% which means that when we apply the standard formula below there is actually no increase in DO2, and there could even be a reduction in DO2.
DO2 = 1.34 x CO x (SpO2/100) x [Hb]
The standard formula for calculating DO2 in ml/min, where each gram of haemoglobin
can carry 1.34 mL of oxygen when saturated, CO is in litres, and [Hb] in g/L.
The problem is further confounded by the fact that in the past there was no direct measure of SV. Most clinicians would be looking for an increase in BP following a fluid challenge, but again this is quite illogical. BP depends on many factors, and there is no direct link between SV and BP. An increase in SV might well be associated with a reduction in HR or a reduction in systemic vascular resistance (SVR). BP could well stay the same despite an increase in SV.
On the other hand, whilst a healthy heart might respond to a fluid challenge with an increase in SV, this is not the case in a failing heart or in the presence of significant myocardial depression. Here the SV response to a fluid challenge will depend upon the inotropy level as shown by the classic work of Starling.
Inotropy
Inotropy (or myocardial contractility) will determine what the SV will be for any given preload, i.e. the degree of ventricular filling at the end of diastole - the left ventricular end diastolic volume (LVEDV), assuming a constant afterload. In critical care however, there is very seldom a stable afterload, a stable preload, or even a stable heart rate. How can we identify whether a low SV is due to a low preload or low inotropy? If inotropy is low, indicating a degree of left ventricular failure, then the heart will not be able to respond to a fluid challenge and the circulation will be further overloaded. If the cause of the low SV is low inotropy, then it is obviously logical to increase inotropy, i.e. the contractility of the left ventricle, but how can we measure this? In the past, the standard answer has been to look at the ejection fraction.
Ejection fraction (EF)
The concept of EF as a measure of inotropy derives originally from an oversimplified view of the work of Starling, as shown in figure 2 below.
Fig 2. Ejection Fraction as a Measure of Inotropy
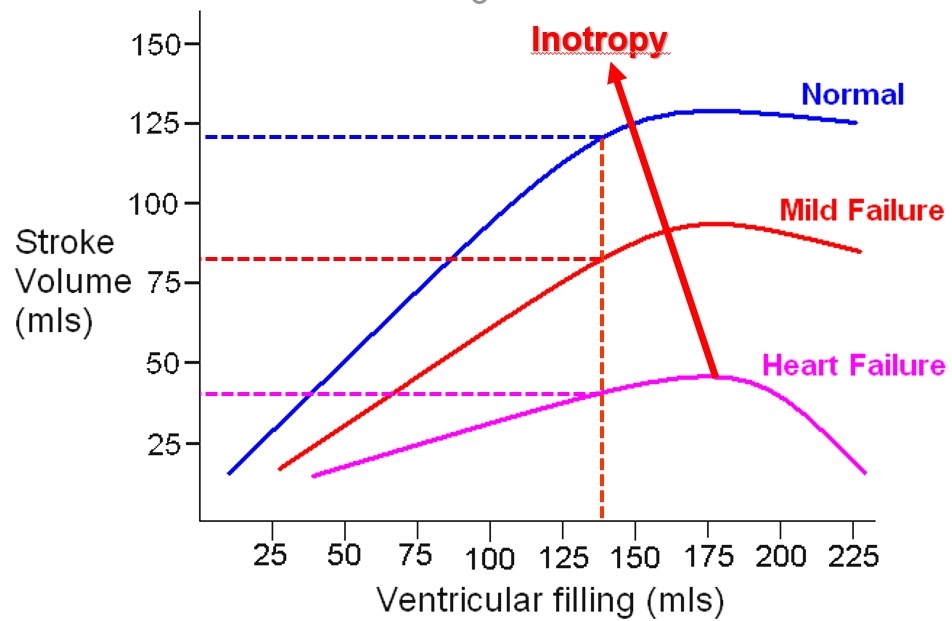
For a given left ventricular preload, there will be different
stroke volumes depending on ventricular function. EF = SV/LVEDV.
For the examples above, 120/135 = 78%; 80/135 = 59 %; 30/135 = 22%.
If we assume for a moment that preload, afterload and heart rate remained the same, then the model would be reasonable. The problem with EF in critical care is that these three factors are influenced by the disease progress and medical therapies, and are constantly varying. If afterload increases then EF decreases. If the patient vasodilates, as in sepsis, then EF increases as the reduced afterload facilitates ejection of a larger SV. This does not mean that sepsis is good for the heart! EF is more a measure of ejection and not a measure of myocardial contractility.
The problem of measuring inotropy in real-world situations was solved by Smith and Madigan with the development of the Smith-Madigan Inotropy Index - SMII (see attached reprint). Using haemodynamic values measured with appropriate, blood-flow based techniques, it is a relatively simple matter to calculate the inotropic state of the heart. With SMII, the cause of a low SV becomes immediately apparent: if the MAP is not elevated, and the SMII is not low, then the low SV must be due to preload deficiency. However, if SMII is low then a fluid challenge will not produce a significant increase in SV and we must therefore use an inotrope. Similarly, if the SV is high, then the cause can be immediately identified and corrected.
Fluid, inotrope or vasopressor?
When faced with the hypotensive patient, clinicians face the dilemma of whether to give fluids, an inotrope or a vasopressor. Frequently, the right choice is not obvious from clinical data alone. BP, HR, SpO2 and capillary refill do not provide much guidance as to which way to turn. On the other hand, if we can obtain the haemodynamic data and put the haemodynamic jigsaw together, then it is immediately apparent what is happening in the circulation and what is needed to correct it. Is the BP too high? Too low? Assemble the pieces and the treatment becomes obvious. Why is the patient shocked? Again, fitting the pieces into the jigsaw shows us the full picture; which haemodynamic parameters are abnormal and how to treat them. Regular measurement of the variables as treatment continues ensures that the patient achieves a satisfactory outcome.
Putting the pieces of the jigsaw together is what haemodynamics is all about. The alternative is to continue using very poor surrogates of haemodynamic variables and interpreting these with little more than educated guesswork. Suitable Doppler ultrasound-based methods have been shown to be accurate and reliable, with overwhelming clinical evidence showing their utility in many areas of clinical practice in general and in anaesthesia and critical care medicine in particular.
Brendan Smith.
April 2020.